Know what changed in your Shopify store.
Every morning.
Karbon Analytics is the ecommerce analytics and decision-making platform for DTC Shopify brands. Every morning, it collects signals from your store and marketing channels and shows you what changed, why it happened, and what to do next.
No credit card required. Set up in minutes.






See what your daily signals looks like
Proactive ecommerce analytics that monitors your Shopify store and ad accounts daily. Surfaces revenue drops, ad waste, inventory risks, and growth opportunities with suggested actions.
Sharp week-over-week revenue decline.
No revenue recorded on a day the store normally receives orders.
Moderate week-over-week revenue decline.
Week-over-week revenue increase.
Significant drop in order count week-over-week.
Week-over-week order count increase.
Average order value decline week-over-week.
Average order value increase week-over-week.
New customer acquisition declining relative to repeat buyers.
New customer acquisition rate increasing.
Repeat purchase rate trend.
Top-selling product approaching stockout.
Trusted by DTC brands




The Karbon Analytics platform
How Karbon Analytics works.
Connect your store and marketing channels once. Your numbers reconcile into one model, Daily Signals surface what changed and why — and dashboards are ready when you want to dig deeper.
[01]
One set of numbers that finally match
Shopify, Meta Ads, Google Ads, GA4, and Klaviyo reconcile into one model — refunds, time zones, and attribution included. Revenue and spend agree everywhere you look.
[02]
Daily Signals that tell you what to act on
40 checks run on your store overnight — revenue cliffs, stockouts, wasted ad spend. You get a short daily brief: what changed, why, and what to do next.
[03]
Dashboards ready on day one
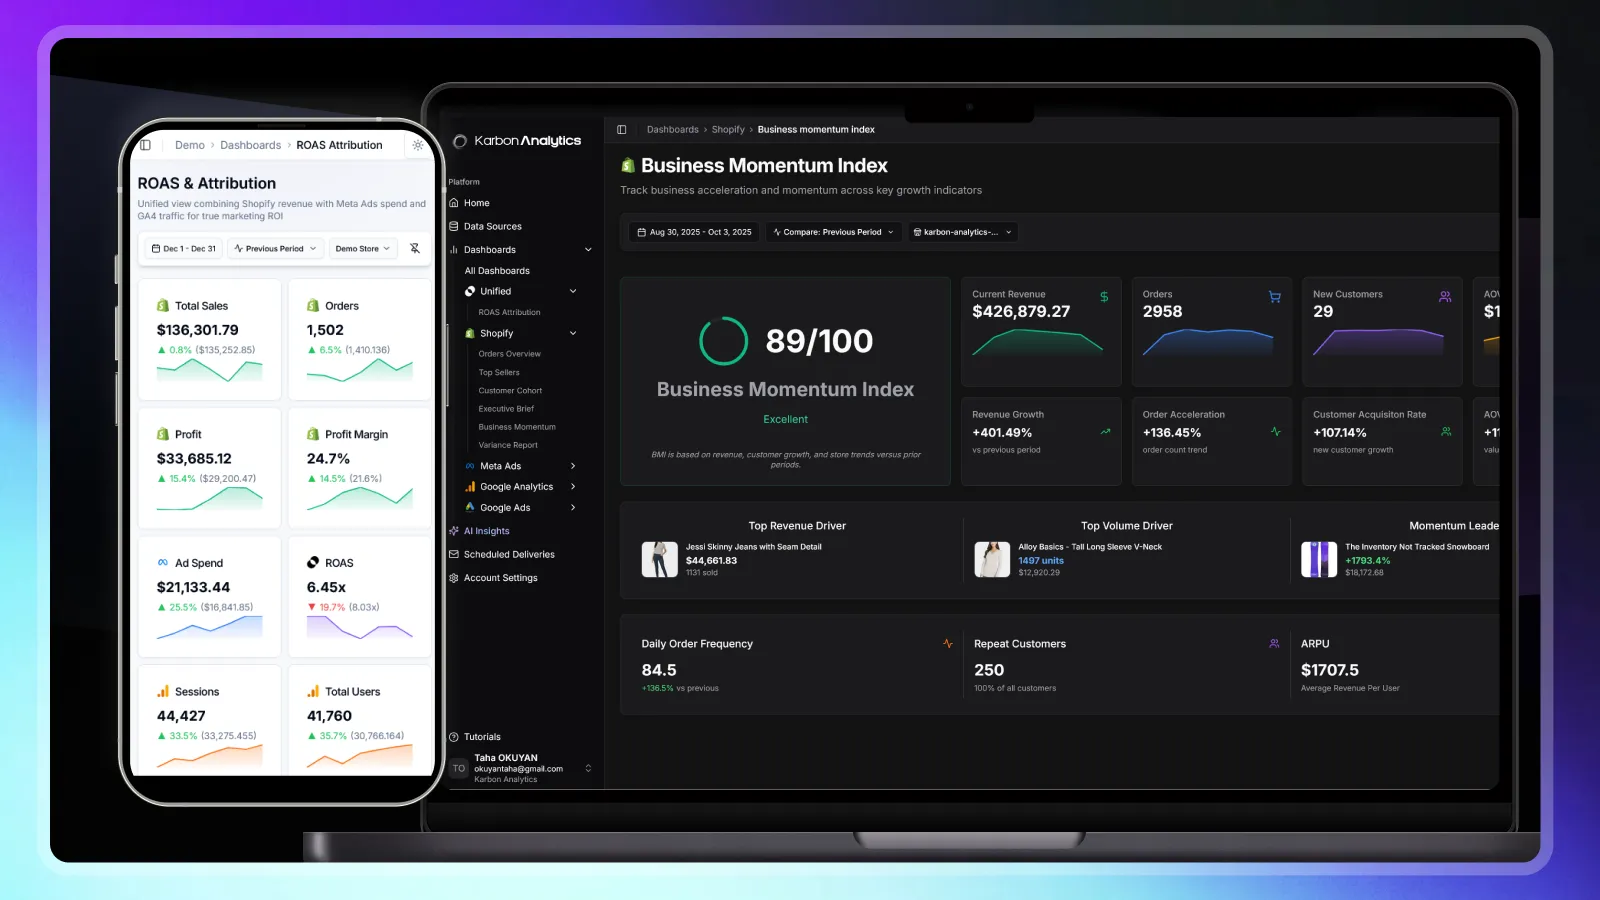
Sales, marketing, customers, inventory, and profitability — pre-built and loaded with your history the moment you connect. There when you want to go deeper.
Why not just build a data stack?
A data stack was built for engineers.
Karbon Analytics was built for operators.
The other option: hire two data engineers, wait six months, pay $8K a month before you see one chart. We hand you a year of your history in 30 minutes instead. Karbon Analytics is the analytics layer for stores that aren't building that: one unified model, dashboards, signals, and AI on top. Connect Shopify; get answers by Monday.
Capability
Traditional Stack

Karbon Analytics
Three to six months
Provision, model, build, wire alerts.
Thirty minutes
Connect your stores and ad accounts. A year of history, ready to explore.
One or two data engineers
Full-time. And a roadmap to keep them busy.
Managed by Karbon Analytics
For ecommerce teams, founders, managers, and operators.
You build it
dbt models, source by source. You maintain it forever.
Pre-built
One unified model across Shopify, Meta, Google, GA4, and Klaviyo.
You design and build
In Looker / Mode / Tableau.
Seven categories on day one
No SQL, no setup.
You write the alerts
And the runbook for each.
40+ detectors run overnight
One brief in your inbox each morning.
Bolt on a separate tool
Hope the numbers match the warehouse.
Reads the unified model
No hallucinated metrics.
$5K–$15K software + two salaries
Warehouse, ETL, BI seats, alerting.
$59–$449/mo
20% off annual. Enterprise available.
Karbon Analytics isn't another piece of your stack. It is the stack. A unified model, dashboards, signals, and AI in one place. No engineers required.
By the numbers
Karbon Analytics already analyzes serious data. Built to handle the volume your store produces.
Frequently Asked Questions

Connect Shopify today. Get your first signal email Monday morning.
Join Shopify stores and marketing teams using Karbon Analytics for unified ecommerce analytics.