Daily Signals for Ecommerce: What Belongs in Your Morning Brief (and What to Ignore)
Why Daily Signals Beat Another Dashboard Tab
Most ecommerce operators do not lack data. They lack a decision rhythm. You open Shopify, then Meta Ads Manager, then a spreadsheet, and thirty minutes later you are tired and no clearer on what to do today.
Daily signals are different from dashboards. A dashboard waits for you to interpret it. A signal points at a specific change and asks whether it matters. The goal of a morning brief is not completeness. It is speed: get to one or two meaningful moves before the day runs away from you.
Working definition:
A daily signal is a notable change in your store or marketing data, compared to your own recent baseline, that may require a decision or a deeper look this week.
TL;DR
- A morning brief should answer three questions: what changed, is it unusual for your business, and what is the smallest next step, not every metric on earth.
- Separate lagging indicators (revenue, orders) from leading indicators (traffic, conversion, ad efficiency) so you know whether to fix acquisition or onsite experience.
- Noise includes normal weekday swings, platform reporting delay, and one-off bulk orders; signals persist or line up across Shopify, ads, and analytics.
- Rank findings by business impact: revenue risk, wasted spend, inventory or fulfillment risk, then creative or audience tweaks.
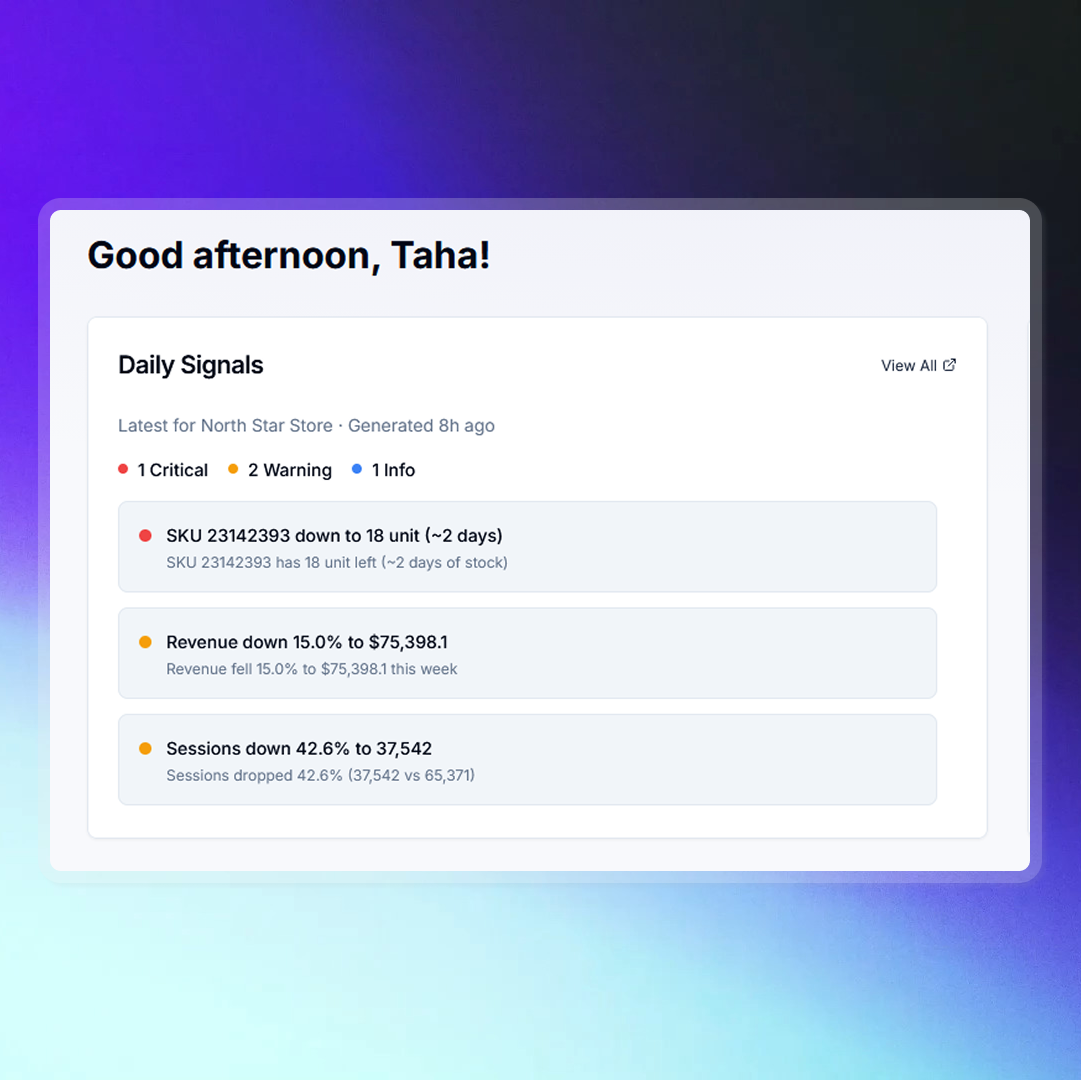
- Karbon Analytics Daily Signals automates this loop: overnight collection, anomaly detection, prioritization, and plain-language next steps in the app and inbox.
- The product tour on our Daily Signals page shows how this shows up in Karbon end to end, with a link at the end of the article.
The Three Questions Every Morning Brief Must Answer
Whether you read a spreadsheet, an email summary, or an app feed, the morning brief should compress into three questions:
- What changed? Pick the smallest honest description. Example: "Conversion from add to cart to purchase dropped this week," not "Something is wrong with performance."
- Is this unusual for us? Compare against the same weekday last week, a four-week average, or pre-sale baselines, not against an arbitrary target you set in January.
- What is the next step? One investigation path is enough: check mobile checkout, review the top campaign by spend, confirm tracking fired, audit a hero SKU. Avoid opening twelve tabs.
If your brief cannot answer those three questions, it is reporting for reporting's sake.
Signal vs Noise: How to Tell the Difference
Not every dip or spike deserves a war room. Noise is normal variation. Signal is a pattern that would change how you spend time or money if you believed it.
Common noise:
- Weekday seasonality: Tuesday vs Saturday will never look the same. Compare like with like.
- Platform lag: Ad platforms and Shopify can disagree for twenty-four to seventy-two hours while attribution and refunds settle.
- One-off orders: A single wholesale-sized order or a creator mention can distort revenue and AOV for one day.
- Cosmetic metric swings: Impressions can move wildly while revenue stays healthy. Start from money and orders, then drill down.
Stronger signals:
- The same unfavorable trend appears in more than one layer: for example, sessions flat but purchases down (conversion), or spend up but new orders flat (efficiency).
- The change persists across several days, not a single printout.
- There is a plausible operational link: stockout risk on a top SKU, a checkout error after a theme change, refunds clustering on one product.
Rule of thumb:
If the story is "bad day," wait for a second data point. If the story is "bad week and conversion or ad efficiency moved with it," schedule the fix.
What to Include in Your Daily Layer
You do not need fifty KPIs at dawn. A lean daily layer usually has four families of metrics. Together they explain most performance swings for a Shopify brand that runs paid acquisition.
1. Outcomes (Shopify)
Net revenue, order count, and average order value (ideally with refunds in the picture). This is what actually happened in the store.
2. Acquisition efficiency (Ads)
Spend, purchases or revenue attributed at the campaign level, and a blended guardrail such as MER (total revenue divided by total ad spend). Platform ROAS alone is a directional input, not the whole truth.
3. Demand and quality (Analytics)
Sessions or users by channel, landing engagement, and funnel steps like add to cart and checkout started. This tells you whether the problem is traffic, onsite experience, or both.
4. Operational risk
Top SKUs trending toward stockout, fulfillment delays, or a refund spike. These often explain revenue changes faster than creative fatigue.
Your brief should surface changes in these families, not static numbers. "MER 3.2" is a billboard. "MER fell from 3.2 to 2.4 while spend held flat" is a signal.
How to Prioritize by Impact
When multiple things move at once, rank by the type of risk:
- Revenue or order volume at risk with no obvious campaign story: check tracking, checkout, payment providers, and inventory first.
- Wasted spend: spend rising without purchases, or MER drifting down while you scale. Pause or narrow before you tweak landing page copy.
- Conversion down, traffic stable: onsite or offer problem: shipping surprises, price displays, mobile UX, stock messages.
- Traffic down, conversion stable: channel or budget issue: audiences, bids, creative, or organic/search visibility.
This ordering saves you from optimizing Instagram captions while checkout is broken.
From Brief to Action in Fifteen Minutes
Try a simple time-boxed routine:
- Two minutes: Skim outcomes. Revenue and orders vs your baseline. Anything off?
- Four minutes: Check acquisition. Total spend, MER or blended ROAS, top two campaigns by spend.
- Four minutes: If outcomes moved, glance at sessions and conversion. Where is the break?
- Five minutes: Write one sentence: "Today I am investigating X because Y." If you cannot name X, you are done until tomorrow.
Fifteen minutes is not lazy. It is focused. The point of daily signals is to buy focus back from your tools.
How Karbon Analytics Daily Signals Helps
Building this manually means exporting CSVs, stitching Shopify with Meta and Google Ads, and deciding every morning what counts as "unusual." Most teams never finish the second step consistently.
Karbon Analytics treats daily signals as a product, not a spreadsheet habit. Your store, ad accounts, and analytics are refreshed overnight. Dozens of checks look for meaningful changes: revenue shifts, efficiency drops, inventory risk, refund spikes, funnel friction, and more. Findings are prioritized by urgency, explained in plain language, and paired with suggested next steps. Critical items can reach your inbox so you do not have to hunt for them inside another dashboard.
If you are ready to spend less time assembling data and more time acting on it, Daily Signals is the difference between owning analytics and letting analytics own your morning. For a step-by-step view of how that looks in the product, including the overnight pipeline, prioritization, and where signals show up each day, open our Daily Signals feature page.
See Daily Signals in Karbon
The feature page is the fastest way to go from this framework to concrete UI: connect, detect, prioritize, and act, without wiring your own morning brief.
Daily Signals product tour
Screens, signal examples, and how top findings surface in the app and in email, so you can judge fit before you spend another week in spreadsheets.