Shopify Conversion Rate Benchmarks (2026): What Is a Good Rate for a DTC Store
TL;DR
- There is no single conversion rate. The common definitions are orders divided by sessions (session rate), converting visitors divided by all visitors (user rate), and orders divided by sessions that reached checkout (checkout rate). They give very different numbers for the same store.
- Most quoted ecommerce benchmarks, including the ones in this guide, use the session-based rate (orders / sessions), which is the Shopify and GA4 default.
- On that session basis, a typical DTC Shopify store sits in the 1.5% to 3.5% range, but it varies widely by industry, device, and traffic source, so a single number is close to useless without context.
- Mobile converts lower than desktop almost everywhere, often by a third or more, so a mobile-heavy traffic mix drags the blended rate down.
- Benchmarks are a starting line, not a goal. Pick one definition, keep it consistent, and watch your own trend.
"Is my conversion rate good?" is one of the most-asked and worst-answered questions in ecommerce, and most of the trouble starts before the benchmark: two people comparing "conversion rate" are often not measuring the same thing. One means orders divided by sessions, another means paying customers divided by all visitors, a third means orders divided by sessions that reached checkout. Same two words, very different numbers.
So before any benchmark is useful, you have to pin down the definition. This guide does that first, then gives typical ranges for DTC Shopify brands in 2026, broken down by industry, device, and traffic source. Treat the numbers as a starting line, not a target.
What Conversion Rate Actually Means
At its simplest, conversion rate is the share of your audience that takes the action you care about:
Conversion Rate = Conversions ÷ Audience × 100
For a Shopify store the "conversion" is almost always a completed order. The disagreement is over the other two parts: what counts as the audience in the denominator, and occasionally what counts as a conversion in the numerator. Change either and the number moves, sometimes a lot, for the exact same store on the exact same day.
Why Teams Define It Differently
There is no single correct definition, only the one your team agrees to use consistently. These are the three you will actually run into.
Session conversion rate — orders ÷ sessions
Orders (or converting sessions) divided by total sessions. The most common definition, and the default in both Shopify and GA4. Because one visitor can open several sessions, the denominator is large, so this is usually the lowest of the three numbers. When someone quotes an ecommerce benchmark without saying otherwise, this is almost always what they mean, and it is what this guide uses.
User (or visitor) conversion rate — paying visitors ÷ all visitors
Converting visitors divided by all unique visitors, sometimes framed as paying users over all users. The denominator counts each person once instead of each visit, so it is smaller, which makes this rate higher than the session rate for the same store. GA4 reports it separately as "user conversion rate." Useful when you care about people, not visits.
Checkout (or cart) conversion rate — orders ÷ sessions that reached checkout
Orders divided only by the sessions that added to cart or reached checkout. This measures the bottom of the funnel, so it is far higher, often 30 to 50 percent, and answers a different question: once someone is serious, how often do they finish? Shopify shows this inside its funnel breakdown (sessions → added to cart → reached checkout → converted).
The practical takeaway: a "2.5 percent" and a "9 percent" can describe the same store measured two different ways. Before you compare yourself to any benchmark, confirm it uses the same definition you do. Mixing them is the single most common reason a brand thinks it is winning or losing when it is neither.
One more wrinkle, even within the session definition: Shopify, GA4, and your ad platforms each count sessions a little differently, so the same store can show three nearby conversion rates at once. Pick one source, usually Shopify, and stay consistent so your trend is honest even when the absolute number shifts between tools.
What Is a Good Conversion Rate?
Every benchmark below uses the session-based rate (orders ÷ sessions), the Shopify and GA4 default, so it lines up with the number most Shopify dashboards already show you. Read against a user-based or checkout-based rate, the same store would look higher.
On that session basis, most DTC Shopify stores land somewhere in the 1.5% to 3.5% range. Below 1.5 percent there is usually clear room to improve; above 3.5 percent you are doing better than most; consistently above 5 percent is exceptional and often points to a strong repeat-customer base or a narrow, high-intent product.
But that blended band hides more than it reveals. The same 2.4 percent rate can mean a thriving supplements brand or a struggling furniture store. The breakdowns below are where the useful signal lives.
Benchmarks by Industry
Conversion rate is shaped first by what you sell. Low-consideration, repeat-purchase categories convert higher; high-price, high-consideration categories convert lower but make it up on order value. These are typical ranges for DTC Shopify brands, not hard rules.
| Industry | Typical conversion rate |
|---|---|
| Health & supplements | 2.5% – 4.5% |
| Beauty & cosmetics | 2.0% – 3.8% |
| Food & beverage | 2.5% – 4.0% |
| Apparel & accessories | 1.5% – 3.0% |
| Home & furniture | 0.8% – 1.8% |
| Electronics & tech | 1.0% – 2.2% |
| Jewelry & luxury | 0.6% – 1.5% |
Notice the pattern: the higher the price and consideration, the lower the conversion rate, and the more the business leans on average order value and lifetime value instead. A furniture brand converting at 1.2 percent is not broken; it is normal for the category. Comparing it to a supplements benchmark would send you chasing the wrong problem.
Benchmarks by Device
Device mix is the second big driver, and the one most likely to mislead. Mobile traffic almost always converts lower than desktop, frequently by a third or more, even though it usually makes up the majority of sessions.
Desktop: typically 2.5% – 4.5% · Mobile: typically 1.2% – 2.5% · Tablet: typically 1.8% – 3.0%
The practical consequence: if your traffic skews 75 percent mobile, your blended rate will look low next to a desktop-heavy benchmark even when each device is performing fine. Always check conversion rate by device before concluding your store has a problem. A mobile-heavy brand should benchmark mobile against mobile.
Benchmarks by Traffic Source
Where visitors come from changes intent, and intent changes conversion. High-intent sources convert far better than top-of-funnel paid social.
Email & SMS: often 3% – 6%+ · Direct & branded search: 3% – 5% · Organic search: 2% – 4% · Paid search: 1.5% – 3% · Paid social: 0.8% – 2%
This is why a brand pushing hard on cold paid social will see its blended conversion rate fall even as revenue grows: it is buying lower-intent traffic. That is not necessarily bad, but it means you cannot read the blended number without knowing the source mix behind it. Conversion rate and traffic quality have to be read together.
How to Improve It
Conversion rate is orders over sessions, so you improve it by removing friction between landing and checkout. The levers that move it most for DTC Shopify brands:
Speed up mobile. Since most traffic and the lowest conversion rate are both on mobile, page speed and a clean mobile layout are usually the highest-leverage fixes. A slow product page bleeds conversions fastest on a phone.
Tighten the product page. Clear photos, honest reviews, obvious pricing and shipping, and a visible add-to-cart do more than most redesigns. Most conversion is won or lost here.
Shorten checkout. Every extra field and forced account creation costs orders. Shopify's express and accelerated checkouts exist because friction at this step is so expensive.
Match the landing page to the ad. If a paid social ad promises one thing and the landing page shows another, intent evaporates. Sending paid traffic to a relevant page lifts conversion more than almost any on-site tweak.
How to Track It Accurately
A single blended conversion rate is the least useful version of this metric. The value is in the breakdowns, by device, by source, by landing page, by new versus returning, over a consistent window, and that is exactly what is painful to assemble by hand across Shopify and GA4 every week.
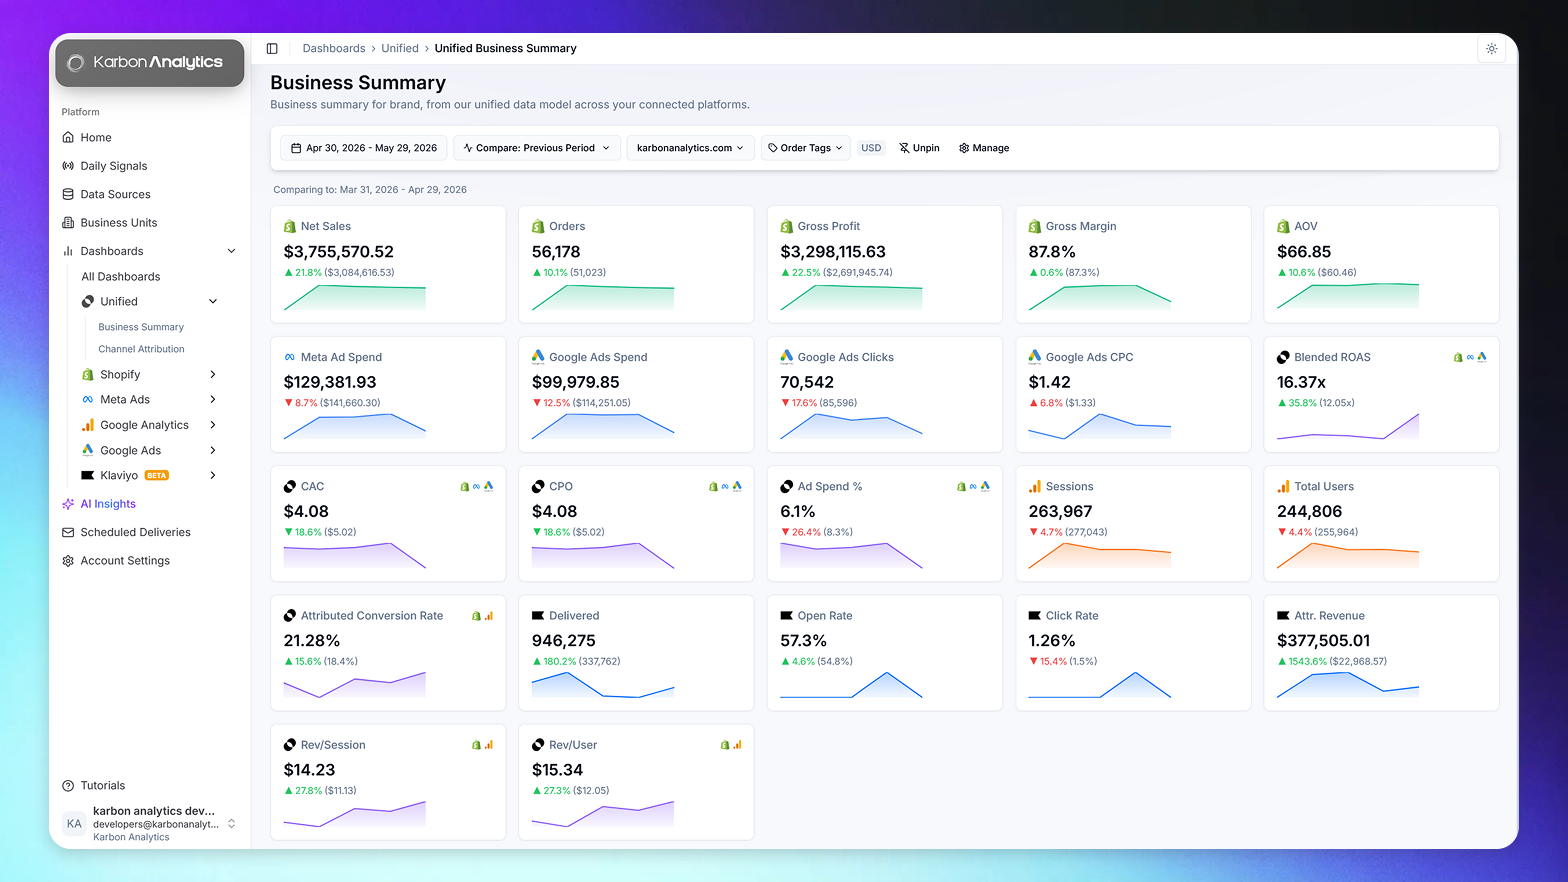
This is where a unified data model earns its place. When sessions and orders read from one reconciled source, conversion rate becomes a live view you can slice by device, channel, and cohort, instead of a number that changes depending on which dashboard you opened. The pre-built Shopify dashboards most operators rely on track conversion rate alongside AOV and traffic source for exactly this reason.
Karbon Analytics tracks your conversion rate automatically, broken down by device, traffic source, and customer type, and reconciled against Shopify orders so the number means the same thing every week. If you would rather watch your real conversion trend than rebuild it from two tools that disagree, start a free trial and connect your sources; your conversion dashboards are live the moment they sync.
See your conversion rate, broken down the way it actually varies
Connect Shopify and your ad accounts. Karbon Analytics tracks conversion rate by device, source, and customer type, reconciled to real orders and updated daily. No more arguing with GA4.
Keep reading