What Is Blended ROAS? How to Calculate It and Why It Beats Platform ROAS
TL;DR
- Blended ROAS is total revenue divided by total ad spend across every channel, expressed as a single ratio.
- The formula is blended ROAS = total revenue / total ad spend. A blended ROAS of 3 means $3 of revenue for every $1 of ad spend.
- It beats platform-reported ROAS because no single channel can over-credit itself. The platforms each count the same sale; blended ROAS counts it once.
- Blended ROAS and MER are the same calculation. The terms are interchangeable.
- It is only trustworthy when revenue and spend come from one reconciled source, which is what Karbon Analytics provides.
Every ad platform you run will tell you it is your best-performing channel. Meta reports a ROAS that makes its spend look brilliant. Google does the same. So does TikTok. Add up what they each claim and the attributed revenue is larger than what your store actually made. Someone is lying, and the answer is all of them, a little.
Blended ROAS is the antidote. It is the one return-on-ad-spend figure that no single platform gets to inflate, because it never asks a platform what it thinks it earned.
What Is Blended ROAS?
Blended ROAS is your total revenue divided by your total ad spend over the same period. It blends every channel, Meta, Google, TikTok, everything, into one ratio instead of measuring each platform on its own self-reported numbers.
The word that does the work is blended. Platform ROAS measures one channel against the revenue that channel claims credit for. Blended ROAS ignores credit entirely. It takes all the revenue your store made and divides it by all the money you spent on ads to make it. That is the whole idea, and its simplicity is the point.
The Blended ROAS Formula
Blended ROAS = Total Revenue ÷ Total Ad Spend
A blended ROAS of 3 means you earned $3 in revenue for every $1 of ad spend. A blended ROAS of 4 means $4 for every $1. Higher is more efficient.
Two choices shape what the number means. First, which revenue: most operators use total store revenue, but using only new-customer revenue gives you a stricter view of whether paid acquisition pays for itself. Second, which spend: at minimum all paid media, though stricter teams also include agency fees and creative costs. Pick definitions and hold them steady, because the trend only means something if the inputs never move.
A Worked Example
Last month your store did $150,000 in total revenue on this ad spend:
Meta Ads: $24,000 · Google Ads: $16,000 · TikTok: $10,000 · Total spend: $50,000
Blended ROAS is $150,000 ÷ $50,000 = 3.0. Three dollars back for every dollar spent.
Now look at what the platforms claim individually. Meta says 4.0 ROAS, taking credit for $96,000. Google says 3.5, claiming $56,000. TikTok says 2.0, claiming $20,000. Together they assert $172,000 in revenue, which is $22,000 more than your store actually earned. They are each counting the same customers, the ones who saw a Meta ad, searched the brand on Google, and bought, and crediting that single sale three times. Blended ROAS counts it once, because it starts from the $150,000 you really made.
Why It Beats Platform ROAS
Platform ROAS is not useless. Inside Meta, comparing one ad set to another on the same reported basis is a fair way to decide what to scale and what to cut. The trouble starts the moment you treat a platform's number as a measure of your real return.
Platforms double-count.
A customer who interacts with two channels before buying is claimed by both. Sum the platforms and you exceed reality.
Attribution windows inflate.
A 7-day-click, 1-day-view window lets a platform claim a sale that would have happened anyway. Blended ROAS has no window to game.
Organic gets ignored.
Platform ROAS pretends paid drove everything. Blended ROAS quietly accounts for the email, SMS, and organic revenue that paid did not cause, which is where a lot of efficiency actually lives.
If your Meta ROAS reads 4.0 but your blended ROAS is 2.0, that gap is the story. It usually means Meta is taking credit for sales that other channels, or your brand itself, would have earned regardless. The same mismatch is why Facebook and Shopify numbers never match. Blended ROAS is the figure you bring to a budget meeting; platform ROAS is the figure you use to tune a campaign.
Blended ROAS vs MER
They are the same calculation. Total revenue divided by total ad spend is both your blended ROAS and your marketing efficiency ratio. The terms are interchangeable, and you will see operators use them in the same sentence.
If there is a shade of difference, it is emphasis. "Blended ROAS" frames the number as a ROAS that blends channels, which is how it tends to come up when you are comparing it against Meta's or Google's reported ROAS. "MER" frames the same number as the efficiency of your entire marketing engine. We go deeper on the framing in the MER guide. Pick whichever word your team already uses and stay consistent.
What Is a Good Blended ROAS?
A good blended ROAS is any number comfortably above your breakeven, and breakeven is set by your contribution margin, not by a benchmark someone posted on LinkedIn.
Breakeven blended ROAS is roughly 1 divided by your contribution margin. Keep 25 cents of profit on the revenue dollar after product cost, shipping, and fees, and your breakeven is about 4.0. Keep 40 percent and breakeven drops to 2.5. Below breakeven you are buying revenue at a loss; above it, the surplus is your profit on marketing.
Rough bands for $1M-$20M Shopify brands: below 2 is a warning unless margins are unusually high; 2.5 to 4 is where most healthy brands sit; above 5 often signals you could spend more aggressively and still profit. The right target is your breakeven plus the margin of safety your cash flow needs.
How to Track It Accurately
The numerator is easy: Shopify knows your revenue. The denominator is where blended ROAS breaks in spreadsheets, because total spend means pulling Meta, Google, TikTok, and every other channel into one figure, in one currency, over exactly the window your revenue covers. Miss a channel or lag a day and the ratio quietly lies.
A unified data model fixes this by reading revenue and every ad platform's spend from one reconciled schema. Then blended ROAS is a live number you can split by new versus returning customer, watch against breakeven, and compare to each platform's reported ROAS to see exactly how much each one is exaggerating. That side-by-side view is one of the most-used pre-built ecommerce dashboards for precisely this reason.
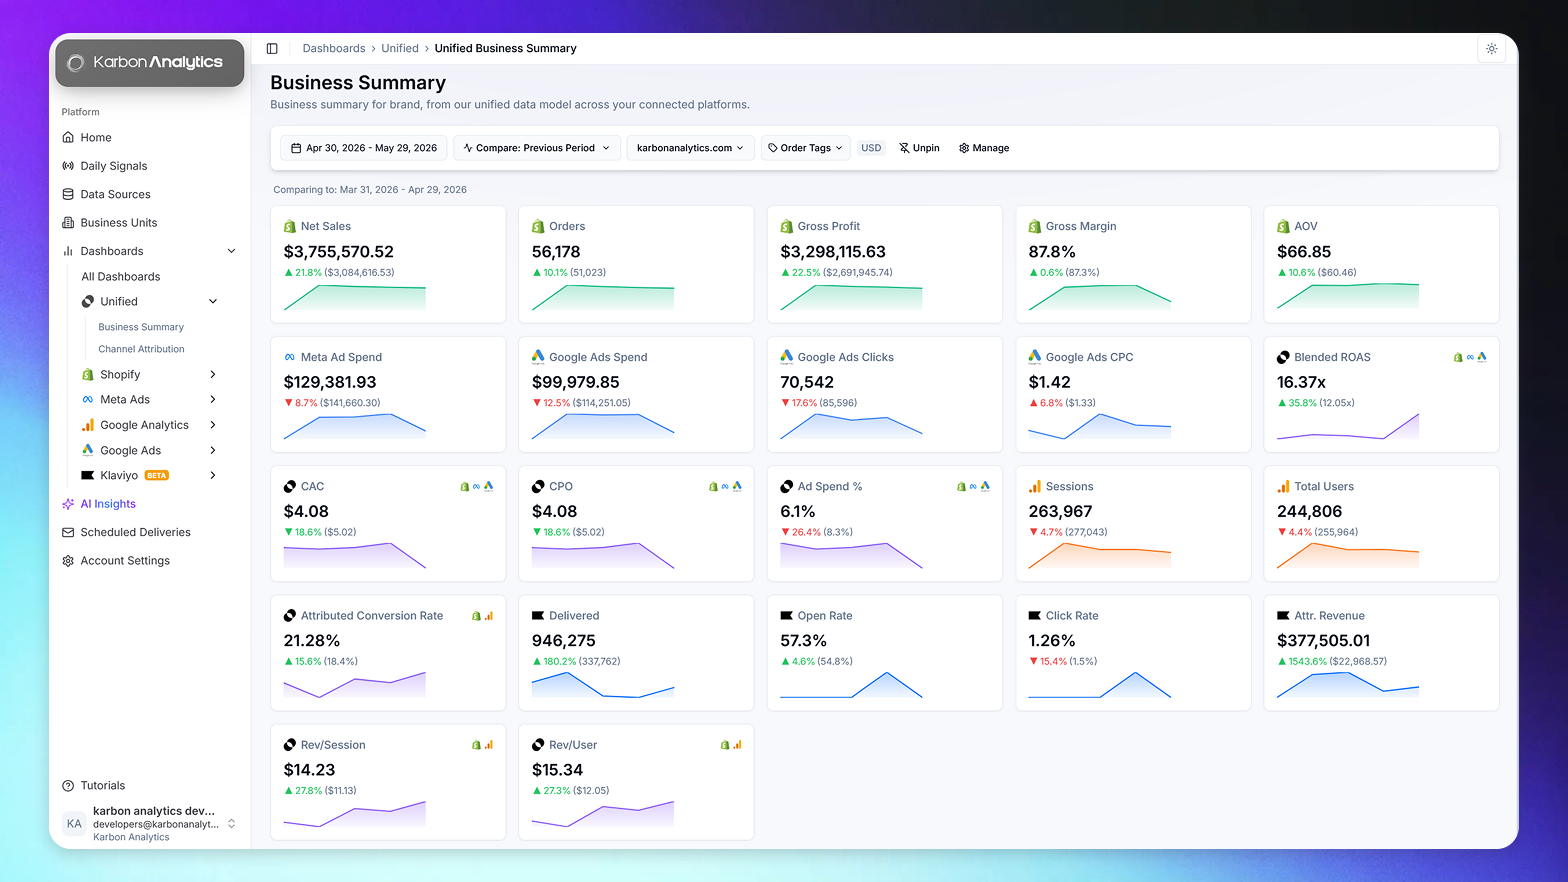
Karbon Analytics computes blended ROAS automatically, reconciling Shopify, Meta Ads, Google Ads, GA4, and Klaviyo into one number and showing it next to each platform's self-reported figure so the gap is impossible to miss. If you would rather trust one reconciled number than referee three platforms, start a free trial and connect your sources.
See platform ROAS vs reality, side by side
Karbon Analytics blends every channel into one reconciled blended ROAS and shows it next to what Meta, Google, and TikTok each claim, so you can see exactly how much each platform is inflating.
Keep reading