What Is MER? The Marketing Efficiency Ratio, Plus a Free MER Calculator
TL;DR
- MER (marketing efficiency ratio) is total revenue divided by total marketing spend across every channel, in one number.
- The formula is simple: MER = total revenue / total ad spend. A MER of 4 means you earned $4 for every $1 spent on marketing.
- Unlike platform-reported ROAS, MER cannot be inflated by attribution windows or double-counted conversions, because it ignores attribution entirely.
- A "good" MER depends on your margins. Most $1M-$20M DTC Shopify brands aim for a MER between 3 and 5, with breakeven set by contribution margin.
- MER is only trustworthy when revenue and spend come from one reconciled source. That is the problem Karbon Analytics solves.
Ask ten DTC Shopify operators what their return on ad spend is and you will get ten confident answers, most of them wrong. Not because the operators are careless, but because every ad platform reports its own number, each one counts the same sale, and none of them agree with what actually landed in the bank.
MER cuts through all of it. It is one number, it is hard to fake, and it answers the only question that matters across your whole marketing budget: for every dollar I spent, how many came back? If you just want the number, skip ahead to the free MER calculator below; otherwise, here is everything that sits behind it.
What Is MER?
MER stands for marketing efficiency ratio. It is your total revenue divided by your total marketing spend over the same period. Some teams call it blended ROAS, because it blends every channel into a single ratio instead of measuring each platform on its own.
The key word is total. MER does not care which ad drove which sale. It does not try to assign credit. It simply takes all the money your store made and divides it by all the money you spent to make it. That refusal to play the attribution game is exactly what makes it useful.
When Triple Whale popularized the term a few years ago, it gave operators a shared vocabulary for a number most of them were already calculating in a spreadsheet: are we, on the whole, spending efficiently?
The MER Formula
The formula is the simplest in ecommerce analytics:
MER = Total Revenue ÷ Total Marketing Spend
A MER of 4 means you earned $4 in revenue for every $1 you put into marketing. A MER of 2 means you earned $2 for every $1. The higher the number, the more efficient your spend.
Two decisions change what the number means, and you should make them on purpose:
Which revenue?
Most operators use total store revenue, including organic and repeat orders. That gives you "total MER." Some use only new-customer revenue, which gives you "new-customer MER" (sometimes called aMER or acquisition MER). New-customer MER is the stricter, more honest measure of whether paid acquisition is pulling its weight.
Which spend?
At minimum, all paid ad spend: Meta, Google, TikTok, anything with a media budget. Stricter teams also fold in agency retainers, creative costs, and influencer fees, since those are marketing dollars too. Pick a definition and keep it consistent so the trend stays meaningful.
A Worked Example
Say last month your DTC Shopify store did $200,000 in total revenue. Your ad spend looked like this:
Meta Ads: $28,000 · Google Ads: $14,000 · TikTok: $8,000 · Total spend: $50,000
Your MER is $200,000 ÷ $50,000 = 4.0. For every dollar of marketing, four dollars of revenue came back.
Now here is why the blended view matters. Open Meta Ads Manager and it might claim 3.5 ROAS on its $28,000, taking credit for $98,000 in sales. Google might claim 4.0 on its $14,000, another $56,000. TikTok claims 2.0, another $16,000. Add up what the platforms claim and you get $170,000 in "attributed" revenue from $50,000 spent, a tidy 3.4 ROAS.
But your store only did $200,000 total, and a big chunk of that came from organic search, email, and returning customers who would have bought anyway. The platforms are each counting sales the others also counted, and sales that paid had little to do with. MER does not let them. It looks at the $200,000 you actually made and the $50,000 you actually spent, and reports the truth: 4.0.
Free MER Calculator
Plug in your own numbers to get your MER instantly, along with the breakeven MER your margin demands. The contribution-margin field defaults to 25 percent; change it to match your store and the breakeven updates with it.
What is contribution margin, and what do I enter? It is the percentage of each sale you keep after the costs that go up with every order: what you pay for the product (COGS), shipping, and payment-processing fees. That leftover is what funds your ads and everything else, which is why it sets your breakeven.
To find yours, take one typical order and do the math: a $50 order that costs you $20 in product, $6 to ship, and $1.50 in fees leaves $22.50. Divide that by the $50 order total and you get a 45 percent contribution margin. Most DTC Shopify brands land between 25 and 40 percent. Not sure? Start with 30 percent and adjust.
MER Calculator
Enter your numbers for any period. Marketing spend is every paid channel combined.
Share of revenue left after COGS, shipping & payment fees. Not sure? 25–40% is typical.
Your MER
4.00
$4 back per $1 spent
Breakeven MER
4.00
at 25% margin
Verdict
Above breakeven
+$0 after ad spend
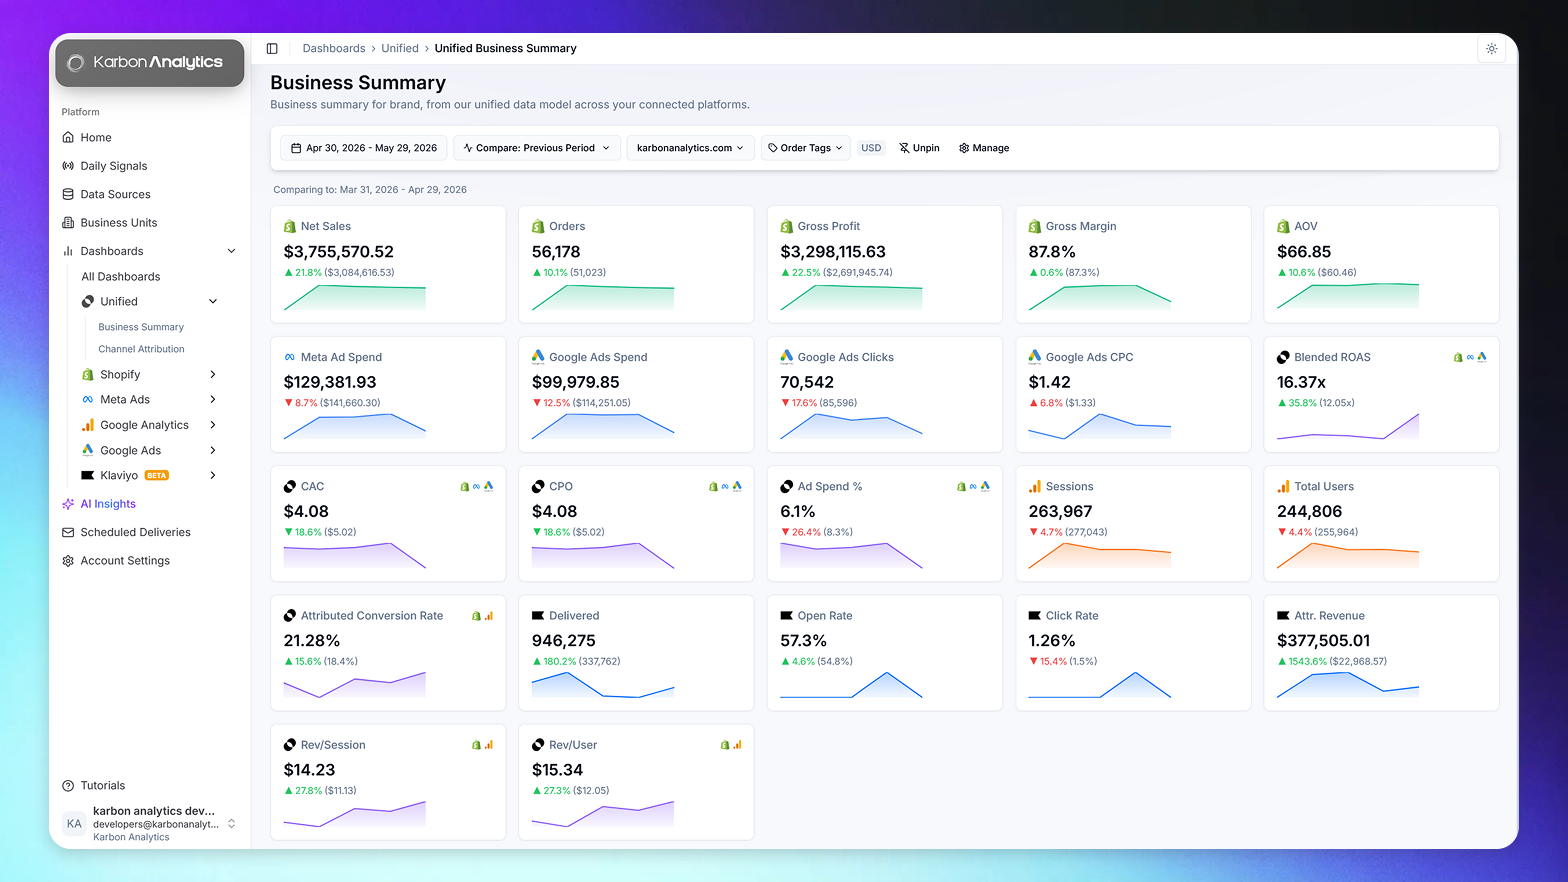
This is one number, calculated once. Karbon Analytics tracks your MER daily across Shopify, Meta, Google, GA4, and Klaviyo, and flags it the day it drops below breakeven.
Track my MER automaticallyMER vs ROAS vs Blended ROAS
These three terms get used interchangeably, which causes most of the confusion. Here is the clean distinction.
Platform ROAS (or channel ROAS)
Revenue attributed to one channel divided by that channel's spend, as reported by the channel itself. Useful for optimizing inside a single platform. Dangerous as a measure of overall efficiency, because every platform over-credits itself.
Blended ROAS
Total revenue divided by total ad spend. This is mathematically the same calculation as MER. "Blended ROAS" and "MER" describe the same ratio. We cover the nuances in the blended ROAS guide.
MER
The same total-revenue-over-total-spend ratio, named to emphasize that it measures the efficiency of your whole marketing engine, not one channel. If anything, "MER" is the term operators reach for when they want the truth layer and "ROAS" is the term they use when talking to a specific platform.
The practical rule: use platform ROAS to decide which ad to turn off inside Meta. Use MER to decide whether your marketing, as a whole, is making money. They answer different questions and you need both.
What Is a Good MER?
There is no universal good MER, and anyone who quotes you one without asking about your margins is guessing. MER has to be read against your contribution margin, because that is what sets your breakeven point.
The breakeven MER is roughly 1 divided by your contribution margin. If you keep 25 cents of gross profit on every revenue dollar after product cost, shipping, and fees, your breakeven MER is about 4.0. Spend more efficiently than 4.0 and you make money; less efficiently and you lose it. If your margin is 50 percent, breakeven drops to 2.0 and you have far more room.
Rough benchmarks for $1M-$20M DTC Shopify brands: a MER below 2 usually means you are buying revenue at a loss unless margins are very high. A MER of 3 to 5 is the healthy band most brands operate in. A MER above 6 often means you are under-investing in growth and leaving volume on the table. The right target is the one that clears your breakeven with margin to spare.
The number to watch is not the absolute MER but the trend. A MER drifting from 4.2 down to 3.4 over six weeks is a signal worth chasing, whatever the starting point.
How to Improve Your MER
Because MER is revenue over spend, you improve it by lifting the top or trimming the bottom. Four levers do most of the work.
Cut spend that produces nothing. The fastest MER gain is usually killing campaigns that spend without returning. Most ad accounts have at least one ad set quietly burning budget on an audience that stopped converting weeks ago. Find it and pause it and your MER rises with no loss of real revenue.
Raise average order value. Bundles, thresholds for free shipping, and post-purchase upsells lift revenue without lifting ad spend, which moves MER directly.
Grow the channels MER does not charge you for. Email, SMS, and organic search add revenue to the numerator while adding little or nothing to the spend denominator. A brand with a strong Klaviyo flow will post a higher MER than an identical brand that relies only on paid, because the repeat revenue rides for free.
Improve conversion rate. The same traffic at a higher conversion rate produces more revenue on the same spend. Site speed, clearer product pages, and a shorter checkout all show up in MER eventually.
How to Track MER Accurately
MER is only as trustworthy as the two numbers feeding it. The denominator is the hard part: total spend has to gather Meta, Google, TikTok, and every other channel into one figure, in one currency, over exactly the same window as your revenue. Do it by hand in a spreadsheet and it will be a day late and a column wrong on the morning you need it most.
This is where a unified data model earns its place. When Shopify revenue and every ad platform's spend read from one reconciled schema, MER is a live tile instead of a Monday-morning chore, and you can break it down by new versus returning customer or watch it against breakeven without rebuilding the sheet each week. Most of the pre-built ecommerce dashboards operators rely on put MER at the top for exactly this reason.
Karbon Analytics calculates MER for you automatically, blending Shopify, Meta Ads, Google Ads, GA4, and Klaviyo into one reconciled number and tracking it against your contribution-margin breakeven every day. If you would rather read your true marketing efficiency than rebuild it in a spreadsheet, start a free trial and connect your sources; your MER tile is live the moment they sync.
See your real MER, updated daily
Connect Shopify and your ad accounts. Karbon Analytics blends every channel into one MER, tracks it against your breakeven, and splits it by new vs returning customer. No spreadsheet, no attribution guesswork.
Keep reading