The Ecommerce Decision Matrix: What to Decide Daily, Weekly, Monthly, and Quarterly at Every Store Scale
TL;DR
- The difference between average and elite operators is rarely information. It is decision cadence: knowing which decisions belong to which time horizon, and refusing to mix them.
- Daily decisions are about protection (broken checkout, wasted spend, stockouts). Weekly decisions are about allocation. Monthly decisions are about economics. Quarterly decisions are about direction.
- The right decisions change with scale: a $5k/month store deciding like an 8-figure brand wastes energy on process; an 8-figure brand deciding like a startup burns cash on gut calls.
- Mixing horizons is the most expensive habit in ecommerce: killing a campaign after one bad day, or ignoring a margin leak for two quarters, are both cadence errors, not data errors.
- The full matrix below gives you the specific decisions per cadence for four store scales, plus the single question each cadence must answer.
- Karbon Analytics automates the input layer, daily anomaly detection, weekly performance rollups, and monthly economics, so your time goes into deciding, not assembling.
Why Cadence Beats Information
Every ecommerce operator has access to roughly the same data: Shopify, an ads manager, GA4, maybe a spreadsheet that only one person understands. Yet some stores compound year after year while others with identical tools stay stuck reacting to whatever caught fire this morning.
The difference is almost never information. It is decision cadence: a deliberate answer to the question "which decisions do I make daily, which weekly, which monthly, and which quarterly?" Operators who lead their category treat time horizons as separate rooms:
- Daily is for protecting the machine.
- Weekly is for allocating money and attention.
- Monthly is for fixing the economics.
- Quarterly is for choosing the direction.
They do not renegotiate their Q3 strategy because Tuesday's ROAS looked ugly, and they do not wait for the quarterly review to notice checkout has been broken on mobile.
A decision matrix assigns every recurring decision to one time horizon, based on how fast the underlying data becomes trustworthy and how expensive the decision is to reverse.
That last clause is the whole trick. Daily data is noisy, so daily decisions must be cheap to reverse: pause a campaign, flag an anomaly, restock a SKU. Quarterly data is stable, so quarterly decisions can be expensive: enter a channel, reprice the catalog, hire. When decision cost matches data reliability, you almost never make a catastrophic call.
The Four Store Scales
The same cadence carries different decisions depending on where you are. We use four scales, segmented by monthly revenue. The boundaries are fuzzy in real life; what matters is which row feels like your Tuesday.
| Scale | Monthly revenue | The situation | The risk that kills you |
|---|---|---|---|
| 1 · Foundation | < $10k | Searching for repeatable demand; one or two people do everything. | Founder attention spread across too many products and channels. |
| 2 · Traction | $10k – $100k | Something works; paid acquisition is real money now. | Spend grows faster than margin, and you find out two months late. |
| 3 · Scaling | $100k – $500k | A team, agencies, real inventory commitments; decisions are shared. | No shared numbers; every meeting argues about whose dashboard is right. |
| 4 · Established | $500k+ | The machine works; durability is the question. | Top-line growth masking cohort or margin decay. |
The Ecommerce Decision Matrix
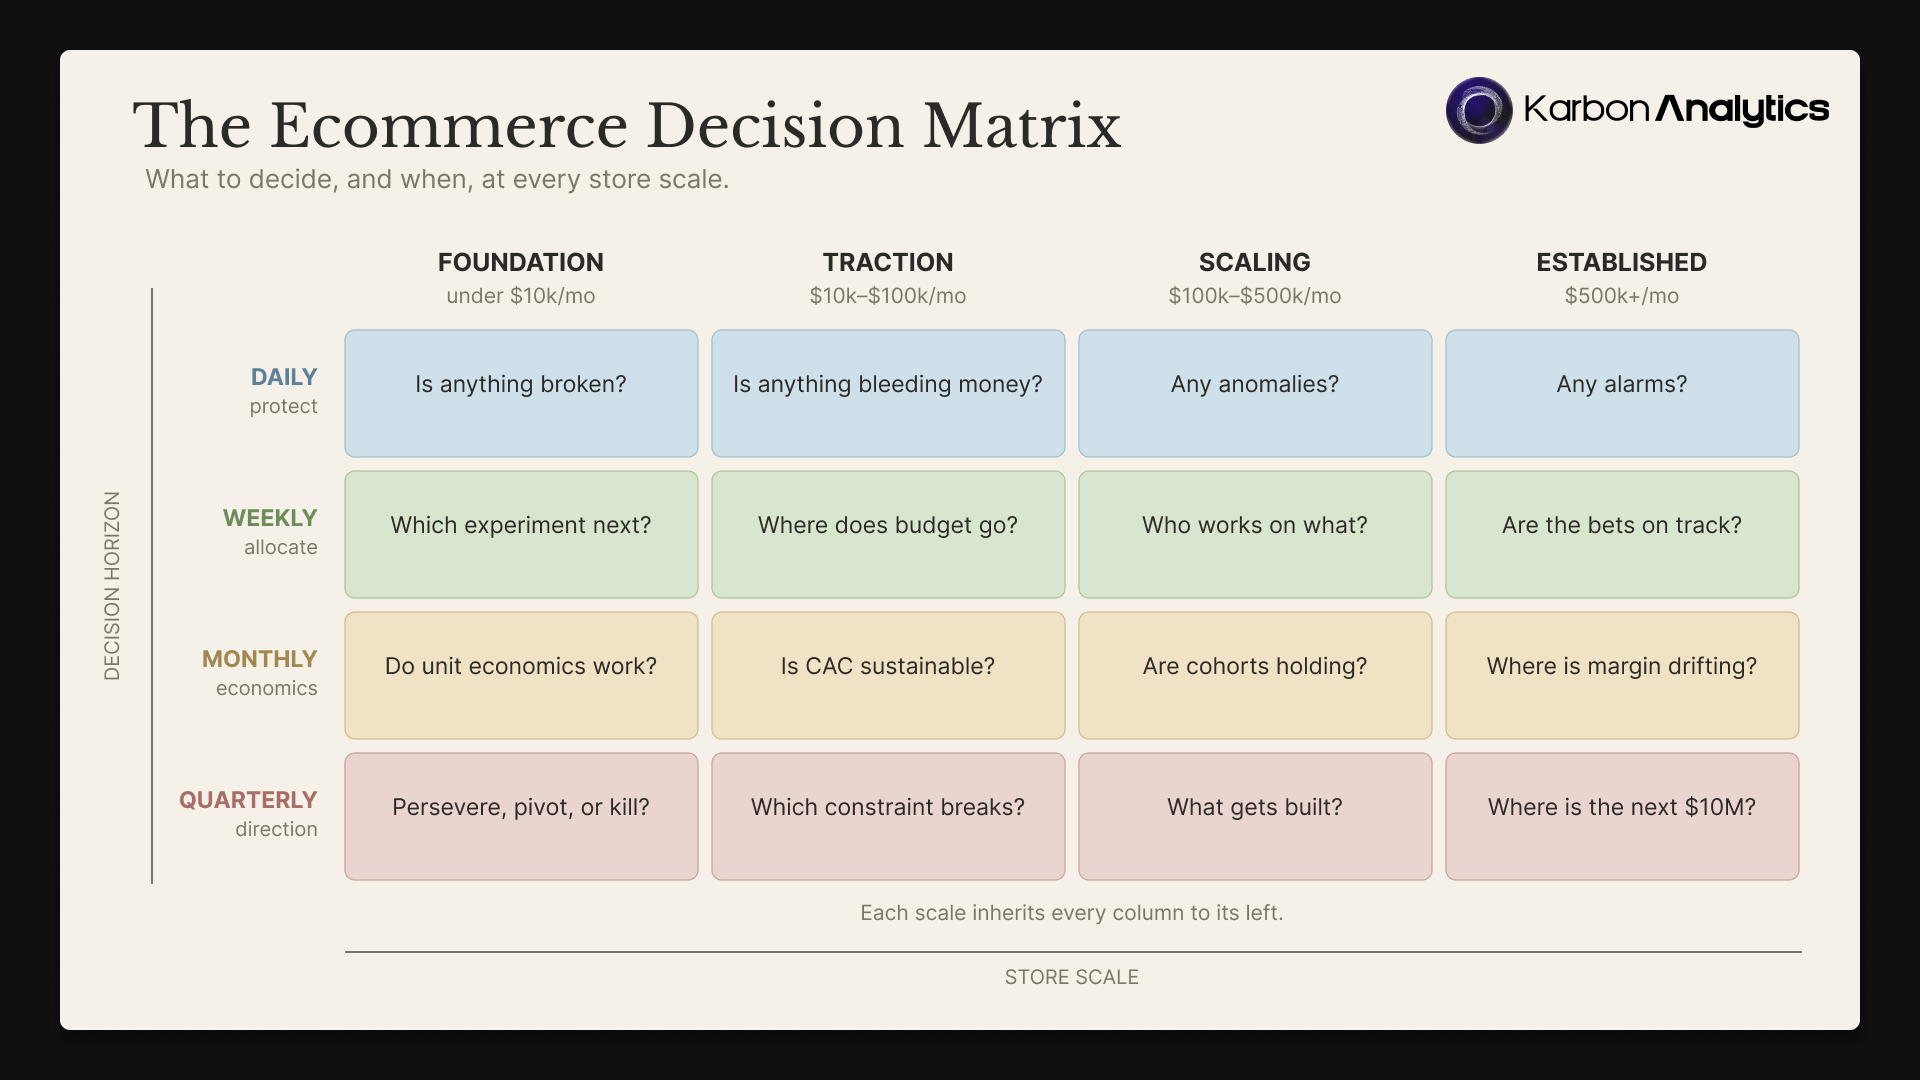
Each cell is the headline decision for that cadence at that scale. Find your column, then run your week down the rows. The sections after the matrix unpack each cadence.
Read the matrix cumulatively: each scale inherits every column to its left. An established store still checks whether anything is broken and whether unit economics work; its cell shows the decision that is new at that scale, not the only one that matters.
| 1 · Foundation | 2 · Traction | 3 · Scaling | 4 · Established | |
|---|---|---|---|---|
| Daily Protect |
Is anything broken? Check site, checkout, and fulfillment in ten minutes, then get back to building. |
Is anything bleeding money? Cap runaway ad sets; save the performance judgment for the weekly review. |
Any anomalies? Triage exceptions only, never the full dashboard. |
Any alarms? Key metrics have owners and agreed limits; leadership hears only escalations. |
| Weekly Allocate |
Which experiment next? Run one offer, angle, or channel test at a time. |
Where does budget go? Shift spend on 7-day data, not daily swings. |
Who works on what? Allocate budget and people from one shared scorecard. |
Are the bets on track? Rebalance acquisition vs. retention vs. launches. |
| Monthly Economics |
Do unit economics work? Compute true margin per order; cut products that lose money. |
Is CAC sustainable? Set the spend ceiling and MER floor from blended CAC vs. first-order margin. |
Are cohorts holding? Check LTV curves, inventory turns, and cash conversion. |
Where is margin drifting? Run a margin bridge; every drift gets an owner. |
| Quarterly Direction |
Persevere, pivot, or kill? Judge on a full quarter of evidence, honestly. |
Which constraint breaks? Pick one: creative, product depth, a new channel, or ops. |
What gets built? Commit to each capability with a budget, an owner, and one metric. |
Where is the next $10M? Set targets from cohort math, not hope. |
If a decision you keep making does not appear in your column, you are borrowing it from another scale, and paying in overhead (too early) or blind spots (too late).
Daily: Protect the Machine
The daily horizon exists for one reason: some failures compound by the hour. A broken checkout, a disapproved ad account, a runaway campaign, a hero SKU going out of stock. The daily question is "is anything broken or burning?", never "how are we doing?" One day of data cannot answer the second question, and pretending it can is how operators end up rewriting strategy every morning.
- Foundation: a ten-minute check: site up, checkout tested, orders fulfilled, any customer message that signals a product problem. Everything else is a distraction from building.
- Traction: add spend protection. Check yesterday's spend against orders, and cap anything clearly failing: multiples of target CAC with zero conversions, not merely "below average."
- Scaling: you can no longer eyeball every metric. Switch from reading dashboards to reviewing exceptions: anomalies in revenue, conversion, spend efficiency, refunds, and inventory against your own baseline.
- Established: daily is delegated. Every key metric has an owner and an agreed normal range; leadership hears about the exceptions, not the weather. If the founder still reads the daily dashboard line by line, the daily layer is broken.
For a deeper treatment of what belongs in this layer and what is noise, see our guide to daily signals and the morning brief.
Weekly: Allocate the Fuel
A week is the shortest period over which ecommerce data becomes honest. Weekday seasonality washes out, attribution mostly settles, and creative performance separates from randomness. That makes weekly the correct horizon for allocation: where money, attention, and creative effort go next.
- Foundation: choose one experiment for the coming week (a new angle, offer, or audience) and judge last week's on the full week. One at a time is not slow; it is the only speed at which results are attributable.
- Traction: reallocate budget across campaigns and creatives using 7-day and 28-day views together. The 7-day view tells you what changed; the 28-day view tells you what is true.
- Scaling: the weekly review becomes a meeting with one shared scorecard: channel mix, creative pipeline, sell-through on key SKUs, and the week's top three anomalies. If the meeting starts with "whose numbers are right?", fix the data layer before the strategy.
- Established: review against targets, not against last week: new-customer efficiency by channel, retention output, progress on the quarter's bets. Reallocate between acquisition, retention, and launches deliberately, in writing.
Monthly: Fix the Economics
Monthly is where the ad platforms stop being the narrator and the P&L takes over. Refunds have settled, invoices have landed, and blended numbers mean something. The monthly question is "does the math still work, and where is it leaking?"
- Foundation: compute true contribution margin per order: price minus product cost, shipping, payment fees, and returns. Most early stores discover at least one product that loses money on every sale. Kill or reprice it this month, not "eventually."
- Traction: compare blended CAC against first-order contribution margin, and set next month's spend ceiling and MER floor from that math. This decision separates stores that scale from stores that just get bigger and poorer.
- Scaling: add the time dimension: are 60- and 90-day cohort LTV curves holding as spend scales? Are inventory turns and cash conversion keeping up? A store can look great on MER and still quietly run out of cash.
- Established: run a margin bridge: exactly which line items moved gross and contribution margin versus last month, and who owns each fix. At this scale a silent 150-basis-point drift is a seven-figure annual problem.
Quarterly: Choose the Direction
Quarterly is the only horizon with enough data to justify expensive, hard-to-reverse decisions, and the only one long enough to see compounding. The question is "are we playing the right game?"
- Foundation: persevere, pivot, or kill, decided on a quarter of evidence: repeat purchase intent, organic pull, unit economics trend. A quarter is long enough to be honest and short enough not to waste a year.
- Traction: name the single constraint that most limits next quarter (creative volume, product depth, a second channel, fulfillment capacity) and aim the quarter at breaking it. Stores at this scale fail by fixing three constraints halfway.
- Scaling: decide which capabilities to build versus rent: senior hires, a retention program, tech stack consolidation, wholesale or international. Each commitment gets a budget, an owner, and one metric that defines success by quarter end.
- Established: model where the next tranche of growth actually comes from using cohort math, not aspiration: what existing cohorts will contribute, what acquisition can add at acceptable CAC, and what only a new category, market, or channel can provide.
The Cadence Mistakes That Cost the Most
Nearly every expensive ecommerce mistake is a horizon error, the right decision made on the wrong clock:
- Deciding weekly things daily. Killing a campaign after one bad day, rewriting the offer every morning, chasing yesterday's ROAS. You pay in whiplash and in ad algorithms that never exit learning.
- Deciding monthly things weekly. Scaling spend because last week's MER looked great, before refunds, returns, and true costs landed. You pay in margin discovered too late.
- Deciding quarterly things monthly. Entering a channel, hiring, or repricing the catalog off one good month. You pay in reversals, and reversals cost more than patience.
- Never deciding at all. The most common one. The data is reviewed, the meeting happens, nothing is decided. A cadence without decisions attached is just recurring anxiety.
Match the reversibility of the decision to the reliability of the data. Cheap-to-reverse decisions can run on noisy daily data. Expensive-to-reverse decisions wait for monthly or quarterly data, no matter how exciting this week looks.
How to Run the Matrix Without Burning Out
The matrix fails when it becomes four more meetings and fifty more metrics. Keep it light:
- Write your column down. Turn your scale's column into four short checklists. If a checklist takes more than 15 minutes daily, 45 minutes weekly, or half a day monthly, cut it.
- End every cadence with a sentence. "This week we are moving budget from X to Y because Z." No sentence, no decision, the session failed regardless of how good the charts looked.
- Let each horizon feed the next. Daily anomalies become weekly investigation items. Weekly patterns become monthly economics questions. Monthly trends become quarterly bets. Nothing skips a level upward, and strategy never leaks downward into the morning check.
- Re-read your scale twice a year. Stores that grow fast keep running last year's column. If revenue crossed a boundary two quarters ago and your decision list has not changed, you are the bottleneck now.
How Karbon Analytics Powers the Matrix
The matrix assumes you can actually see the data each horizon needs: clean daily anomalies, honest weekly rollups across Shopify and ad platforms, and monthly economics that match the P&L. Assembling that by hand is exactly the work that crowds out deciding.
Karbon Analytics is built around the same layered rhythm. Daily Signals runs the daily layer for you: overnight collection across your store, ads, and analytics, anomaly detection against your own baselines, and prioritized, plain-language findings each morning. Dashboards and automated reports carry the weekly and monthly layers, blended metrics like MER and CAC included, so your weekly review starts with one shared set of numbers instead of a reconciliation debate.
That leaves you with the part software cannot do, and the part that makes operators stand out: the decision itself.
Run your decision cadence on autopilot inputs
See how Daily Signals, dashboards, and automated reports map to the daily, weekly, and monthly layers of the matrix, so every review starts with answers instead of exports.
Keep reading